On human thermal perception of weather and climate
Human thermal perception of weather and climate is deeply subjective, and this was already recognised by Alexander von Humboldt in the early 1800s. He wrote the following in his book Cosmos: ‘In its most general sense the expression climate denotes all changes in the atmosphere that noticeably affect our organs: temperature, humidity, the serenity of the sky, which is not only important for the organic development of plants, the ripening of fruits, but also for feelings and state of mind.’ However, these thoughts were somehow forgotten.
Then, about 200 years later, the first modern methods – computer humanoids – appeared to help us estimate human thermal comfort. These are mathematical representations of the biophysical system of the human body. Standardised human body parameters (body mass, body length – the field uses this term, sex and age) are used in these computer models, such as the Physiologically Equivalent Temperature (PET) or the Universal Thermal Climate Index (UTCI), that do not take into account variability between individuals. So, for instance, in the PET model the standardised human is a 35-year-old male with a body mass of 75 kg and body length of 175 cm. Nevertheless, humans differ, not just in spirit, but also in terms of body shape, and, perhaps these body shape differences have no negligible role in human thermal perception. In this short text we will try to demonstrate the importance of personal variability in the modelling of human thermal perception of weather and/or climate.
Scatter charts
Two thermal perception point-clouds of two persons are presented in the following figure.
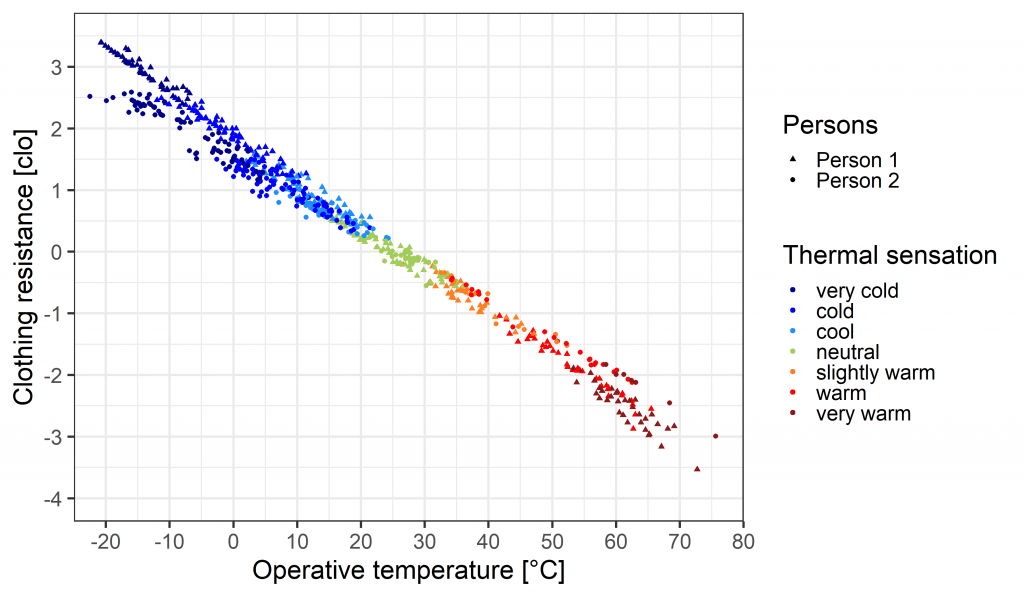
The person indicated by the triangles is a 65-year-old male (body mass: 89 kg; body length: 190 cm), whilst the person marked by circles is a 34-year-old female (body mass: 64.5 kg; body length: 160.5 cm). Note that the body shapes are quite different (person 1 is much less endomorphic than person 2; endomorphic = a more round body shape), though their energy consumption while walking (walking speed of 1.1 ms-1) is almost the same (person 1: 135 Wm-2; person 2: 142 Wm-2; the individuals are not sweating). The thermal sensation types used (three categories for cold, neutral, and three for warm) are marked with colours (blue for cold, green for neutral and red for warm). Both persons are native of the Hungarian lowland region, where the Köppen climate formula is Cfb (C–warm temperate, f–no seasonality in the annual course of precipitation, b–warm summer).
Each point represents a weather situation. There are 370 and 317 points in total for persons 1 and 2, respectively. The weather data refer to the home locations of persons 1 and 2 and are collected in all seasons and parts of the day (daylight period, night). The data were taken from the nearest automatic meteorological station operated by the Hungarian Meteorological Service. The X axis (operative temperature) represents the thermal load of the atmosphere. The Y axis (clothing resistance) represents the thermal load caused by the atmosphere and activity (in this case walking) together. Clothing resistance (rcl) is a parameter, which is interpreted as follows: if there is a heat surplus, the human body needs cooling to reach energy balance, in this case, rcl is negative; if there is heat deficit, the human body needs warming to reach energy balance, in this case, the values of rcl are positive. When the human body is in energy equilibrium, neither cooling nor warming is needed, and this neutral state is sensed as comfortable. The term rcl is commonly expressed in the unit clo, which was introduced in the mid-1900s to characterise the thermal properties of clothing. The clothing usually referred to as a suit (jacket, trousers, shirt, underwear) has a clothing resistance value of about 1 clo.
Comparing charts
The scatter chart representing change in clothing resistance versus operative temperature and/or thermal sensation types is person-specific. Comparing two such scatter charts, we obtain an insight into how subjective human thermal perception really is. Examining Fig. 1, two things may be observed:
- The smallest inter-person deviations in rcl (deviations between the triangles and the circles) are in the neutral thermal regime (green zone, the values of rcl are around zero, between +0.5 and -0.5 clo). The largest inter-person deviations in rcl appeared in extremely cold weather (dark blue zone, where rcl is larger than 2.5 clo) and extremely warm weather (dark red zone, rcl is less than -2.0 clo), amounting to about 0.5 clo.
- It is also obvious that adjacent zones are not unequivocally separated, with mixing occurring between them regardless of the person. This fact shows that the human thermal sensation spectrum is continuous, and it is hard to separate it into different discrete types such as ‘cold’, ‘cool’, ‘slightly cool’, ‘neutral’ and so on. Of course, this depends also on a person’s psychological state, which is extremely subjective.
The thermal load results (clothing resistance and operative temperature) are obtained by using an energy balance based model without considering human thermoregulation processes (e.g. sweating, shivering, vasodilation, vasoconstriction), however, these thermal sensation results are observations. During thermal sensing (usually lasting five minutes), sweating and shivering is not registered, of course, the observers were not aware of their vasodilation and vasoconstriction processes, not to mention other hidden thermoregulatory processes. The thermal load model used is extremely simple since it does not simulate thermoregulatory processes and it can be equally used with weather and climate data. As we see, there are individual differences in the sensation of the thermal load of weather and/or climate and these differences increase going towards cold (e.g. rcl values above 2 clo) or heat (e.g. rcl values below -2 clo) stresses. There are indications that not only thermal load but also thermal sensation may be related to human body shape. If this relationship is statistically justified, the treatment of the subjective nature of human thermal perception would be more quantifiable.
References
Authors: Ferenc Ács, Erzsébet Kristóf, Annamária ZsákaiWritten By
Ferenc Ács
University Eötvös Loránd, Department of Meteorology
Contact Details
Email: acs@caesar.elte.hu
Telephone: ++36302929408