Presenting a case for molecular scales in atmospheric models
Modelling Earth’s atmosphere is a monumentally difficult task, and atmospheric scientists have long faced challenges in accurately recreating the large-scale processes they observe in real life. Dr Adrian Tuck, a retired former visiting professor at Imperial College London, proposes that models could be improved by accounting for processes which take place on molecular scales. Through a better explanation of the turbulence that emerges at this level, his results could help researchers to better link together a wide variety of crucial atmospheric processes in their models.
Earth’s atmosphere is a deeply intricate and ever-changing system. Owing to the complex interplay between factors including wind, temperature, humidity, and the radiation absorbed and reflected by airborne chemicals, the atmosphere can never settle into a state of equilibrium, but it may attain a temporary steady state. This means that in order to understand the processes they observe, and predict how they will change in the future, atmospheric scientists need simultaneously to draw from the fields of chemistry, fluid dynamics, and radiative physics.
One particularly broad area of atmospheric science studies turbulence: the small-scale, irregular motions of air, which can vary widely in speed, temperature, and direction. Turbulence plays a key role in processes including chemistry, radiative transfer, cloud formation, interactions with ecosystems, and the transport of water and pollution. To predict future changes to the atmosphere, therefore, it is crucial for researchers to account for its influence within their models.
Yet even after nearly two centuries of efforts to solve atmospheric air motion, meteorologists still can’t fully account for the influence of turbulence on larger-scale processes, or to accurately model the behaviours they observe in real life – more so in the Southern Hemisphere. Through his research, Dr Adrian Tuck aims to address the problem by using fractal methods for analysing observations of turbulence and suggesting new ways to describe its influence.

Top-down modelling
When describing the energy dispersed by a physical system across the range of large to small scales, increasing the overall disorganisation of the system, researchers use a quantity named entropy. Within an isolated system, which doesn’t interact with any other external system, the second law of thermodynamics demands that entropy can only increase as processes occur.
This may be a fundamental law, but in reality, few natural systems can ever be fully isolated in an environment like Earth’s atmosphere, where interactions between numerous complex systems are happening constantly, and are widely influenced by the effects of turbulence. As a result, there are difficulties when it comes to defining entropy in this context.
Few natural systems can ever be fully isolated in an environment like Earth’s atmosphere.
So far, researchers have widely taken a ‘top-down’ approach to the problem. This involves making observations across large-scale regions, and constructing broad statistical laws to describe them. These efforts are based on the assumption that small-scale turbulent processes and the resulting fluctuating chemical distributions will rapidly equilibrate, so their effects effectively become negligible on larger scales. In turn, larger-scale processes can be mathematically modelled in computers, largely without addressing the smaller-scale processes underlying them.
Searching for a bell curve
These types of broad description often rely on a statistical relationship named a ‘bell curve’, which defines the probabilities of certain quantities being observed across a range of possible quantities. In the most simplistic cases, the most likely outcome will sit at the top of a bell curve, while those least likely will be found at its edges. Bell curves fall off exponentially, with low probabilities in the wings.

Bell curves can accurately describe features like height distributions within a group of people. Since people with average heights will be more common, they will be found at the top of the curve, while the tallest and shortest people will lie at its edges. In some more complex cases the curve may spread out or become thin, or be skewed to one side or the other. Even in these cases, the curves can still be accurately described mathematically.
If the same relationship could be applied to atmospheric variables, it would imply that small-scale variations in wind speeds and temperatures, directions, and chemical distributions caused by turbulence should also lie on a bell curve. Furthermore, the shapes of these curves could be expected to spread and skew to varying degrees as altitude and position changes, corresponding to larger-scale patterns taking place in the atmosphere. To determine whether such a top-down description is accurate, Dr Tuck turns to extensive observations made by NASA and the NOAA, using techniques developed by Daniel Schertzer and Shaun Lovejoy and analysed by Aiden Hovde.
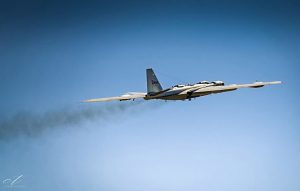
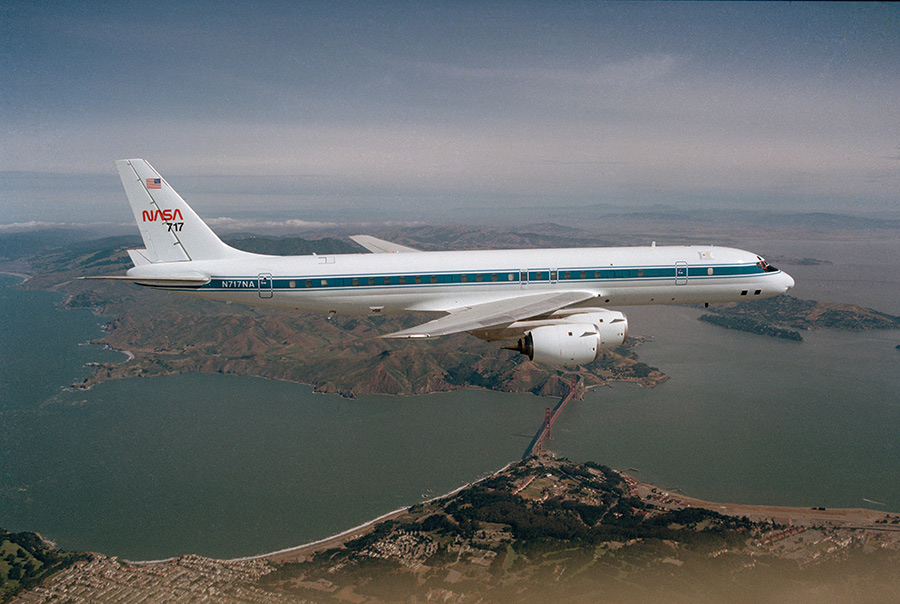
Over several recent decades, these organisations have studied the atmosphere through measurements taken by research aircraft with horizontal flight paths, as well as monitoring devices (‘dropsondes’) that fall vertically on parachutes from one of these aircraft. Through his research, Dr Tuck and his collaborators have analysed aircraft observations taken above a broad area of the eastern Pacific Ocean in the Northern Hemisphere, up to altitudes of 13 kilometres. He has also studied measurements of the polar night jet stream: the belt of powerful winds which encircles the Arctic and Antarctic at the lower boundary of the stratosphere, roughly 20 kilometres above Earth’s surface.


Uncovering a discrepancy
By analysing turbulence in these measurements, Dr Tuck and his collaborators have discovered a key discrepancy with existing top-down methods for modelling atmospheric variables. Far from displaying bell curve shapes, the probability distributions of wind speeds, directions, temperatures, and chemical species were distinctly asymmetric, with ‘fat tails’. This would have profound effects on larger-scale processes including chemistry, water transport, and the atmosphere’s radiative properties. It signifies long-range correlations and scale invariance – the aircraft traces look similar no matter what scale one chooses to examine.
Ultimately, the discrepancy means that models which only consider larger-scale laws are overlooking a fundamentally important aspect of the atmosphere’s overall behaviour. To illustrate this, Dr Tuck describes atmospheric turbulence as a ‘multifractal’ system, based on the work of Lovejoy and Schertzer. These systems can be widely found in nature: one widely used example is the measurement of a country’s coastline.
If a coastline’s length is determined by placing measurement stations one kilometre apart along the shore, measurements wouldn’t be able to register many smaller features, including coves, inlets, and outcrops. However, these features could appear if a larger number of more closely-spaced measurement stations are used. As a result, the exact same coastline would be measured to be longer – and its measured length would only increase as the separation between measurement stations decreases further.
Accounting for multiple scales
In the context of atmospheric turbulence, multifractal properties can cause atmospheric models to change, depending on the smaller-scale behaviours which researchers choose to include. By adapting their models to include the movements and collisions of individual molecules statistically, atmospheric scientists could examine a number of key discrepancies between existing top-down models and real observations.

Among these factors would be the observed correlation between large, short-term changes in temperature observed in the stratosphere, and the rate of ozone fragmentation by solar radiation. Such correlations have been observed by aircraft in and around the stratospheric polar night jet stream. The process is connected to the lower gravitational fields and decreasing pressures found at these altitudes.
Dr Tuck has determined that the driving force for the emergence of molecular-scale turbulence is enabled by a quantity named ‘Gibbs free energy’.
By interpreting these results, Dr Tuck has determined that the driving force for the emergence of molecular-scale turbulence is enabled by a quantity named ‘Gibbs free energy.’ Described as the difference in entropy between incoming beams of radiation from the Sun, and radiation which passes from the atmosphere back into space, this energy is carried by the fastest-moving molecules in the atmosphere. It can do the work necessary to drive atmospheric motion.

In accounting for the effects of turbulence on chemistry, radiation, and fluid dynamics of the atmosphere on a molecular basis, Dr Tuck advocates a shift from a top-down to a ‘bottom-up’ approach to modelling atmospheric entropy. Such an approach would start by accounting for molecular-scale processes, and then study the effects that emerge on larger scales. In turn, it could address the ‘cold bias’ in existing global-scale models – describing how current predictions of the stratosphere tend to be more skewed towards colder temperatures than real observations would suggest.
A deeper understanding
Ultimately, by drawing on these principles to account for the deeply complex interplay between chemistry, radiation, and fluid dynamics on molecular scales, Dr Tuck hopes that researchers will soon be able to develop more accurate atmospheric models. In turn, this could help meteorologists to better understand how the atmosphere behaves on a global scale, and to better predict how it will change as Earth’s climate warms.

Personal Response
Could accounting for molecular-scale effects on turbulence in computer models lead to better predictions of climate change?
I hope so – so far it is an untested hypothesis.