New technology for earthquake prediction: Nankai Trough, Japan
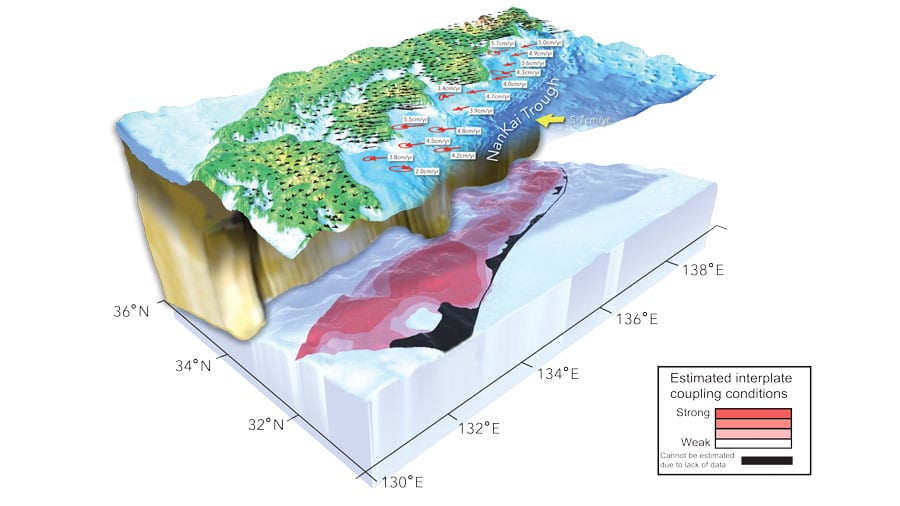
The Nankai Trough subduction zone between the Philippine Sea plate and the Amur plate has been the site of many interplate megathrust earthquakes – those that occur when one tectonic plate is forced under another by slip along the point at which they converge, known as the thrust fault. Predictions suggest that the next earthquake in the region will occur in the near future, so monitoring systems are needed to interpret an interplate boundary condition and try and predict when and where this may occur. Megathrust earthquakes are driven by accumulated interplate slip deficit – so historic megaquakes are thought to have occurred on an interplate boundary with a high slip deficit rate (SDR). Therefore, understanding the distribution of SDR in the zone is key to predicting the scale of future earthquakes and tsunamis. Previous geodetic studies attempting to create a mapping of the SDR have been limited by the fact that the observation network was limited to land areas and so did not capture the full picture for the seafloor.

A new measurement approach
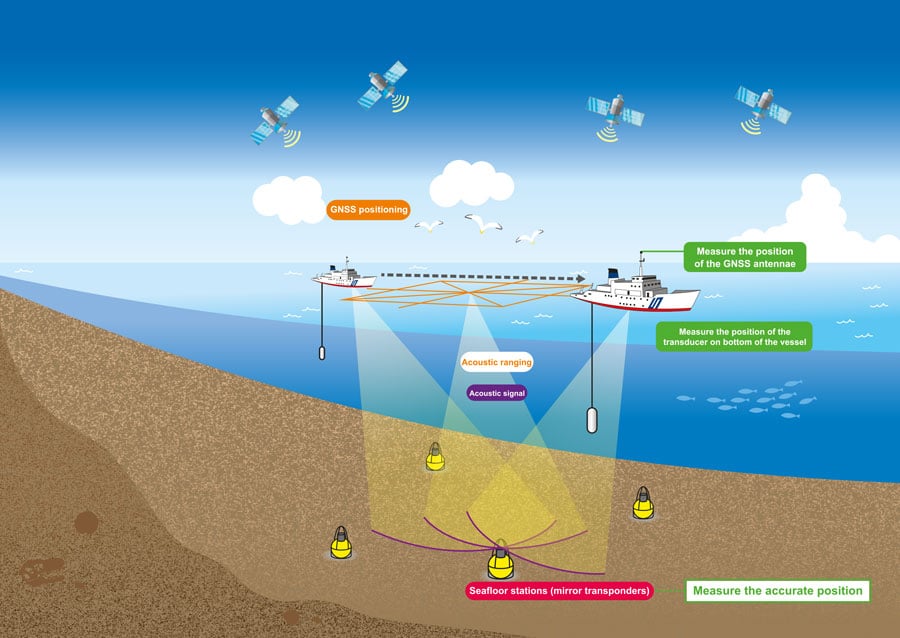
Dr Yokota, his team, and seniors have spent two decades developing a new approach to obtaining seafloor geodetic information for the entire region. This effort has focused on a seafloor observation network using a combined Global Navigation Satellite System (GNSS; e.g., Global Positioning System) and acoustic ranging technique. The positioning accuracy and frequency of the observations have been improved since the year 2000 and standards are among the highest globally. The Geospatial Information Authority of Japan has established a dense GNSS observation network called GEONET, which has detected interplate earthquake cycles and various slow-slip events on interplate boundaries. Satellite geodesy using electromagnetic waves enables the distance of the earth from the satellite to be determined precisely (onshore), but the position of the seafloor cannot be accurately determined by electromagnetic waves due to scattering and absorption of the waves by seawater. The GNSS-A technique combines satellite radiowave data with acoustic data measured from under the sea. The seafloor geodetic observation network along the Nankai Trough, Sagami Trough and Japan Trench has been under construction since the 2000s. The measurements are made from a survey vessel.

[An interplate megathrust earthquake] is predicted in the near future along the Nankai Trough off southwestern Japan.
The observation systems
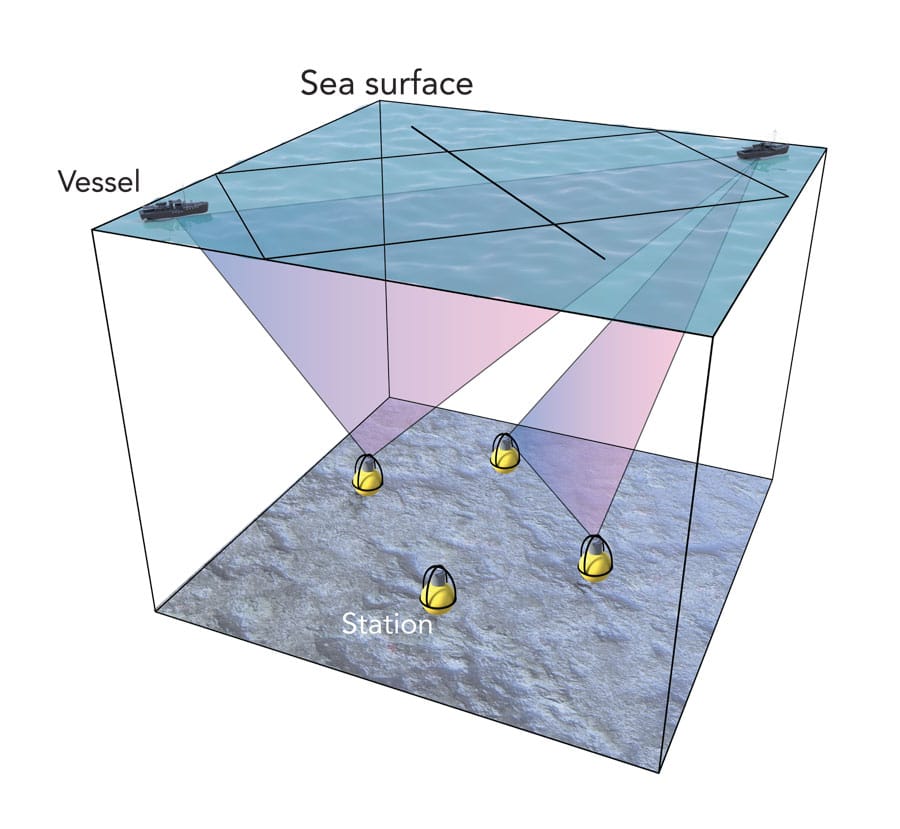
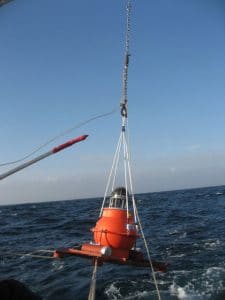
There are over 15 observation sites along the Nankai Trough: six established before the 2011 Tohoku-oki earthquake, and others deployed subsequently in order to produce a complete picture of the SDR distribution. The observation system consists of a seafloor unit with multiple acoustic mirror transponders (devices for receiving and emitting an acoustic signal), and a sea surface unit with an acoustic transducer (a device for converting the acoustic signal into electric signals), a GNSS antenna-receiver and a dynamic motion sensor, to measure the attitude (tilt) of the survey vessel. The sea surface equipment is located on a survey vessel. The position of the GNSS antenna is also measured. The distance between the surface acoustic transducer and each seafloor transponder is determined by acoustic ranging: i.e. the seafloor transponders receive acoustic signals from the sea surface transducer and send them back, and the total travel time for the acoustic signal is measured. Data from several hundred to several thousand acoustic signals were combined, and the researchers then combined information about the sea surface transducer position and travel time to determine the position of the seafloor transponders.
Since 2008, the GNSS-A measurement system has been mounted on the observation vessel permanently, with the acoustic transducer mounted on the hull and the GNSS antenna mounted on the top of the main mast, in order to improve the accuracy of the measurements. The measurements can now be taken while the vessel sails along, reducing the time taken to collect the observations from 2-4 days to 16-24 hours.

Observing seafloor structure for earthquake monitoring
The interseismic period data revealed the seafloor speeds resulting from the subduction of the Philippine Sea plate under the Amur plate. The data was used to obtain an SDR distribution through collaboration with the onshore GEONET data – this was better than results from onshore data alone which cannot resolve offshore interplate boundaries. Dr Yokota and his team’s data were able to reveal most previously unknown undersea regions, except for some of the areas directly adjacent to the Nankai Trough.
Our findings provide information for inferring megathrust earthquake scenarios and interpreting research on the Nankai Trough subduction zone.
Further analysis showed that three of the regions studied had very-low-frequency-earthquake (so-called VLFE) activity: these were the regions with low SDR values, confirming that low SDR is linked to VLFE activities. This relationship was also predicted in previous observational studies. The relationship probably results from elevated pore-fluid pressure (the pressure of the fluid contained in the gaps between the particles within the rocks) and a complicated fracture network.

Two high SDR zones were also identified in which there are no historical records of previous earthquakes. Therefore, they have accumulated slip deficit, and could drive shallow ruptures and tsunamis near the trench axis. However, the lower SDR zones observed in between the high SDR zones could regulate earthquake dynamics, as happened in the 1944 Tonankai earthquake when an earthquake was halted in a low SDR zone. The researchers aim to continue monitoring the region in order to investigate whether the interplate SDR distributions change over time. The detection of the SDR time change (or long-term slow slip event) will be reported in the very near future. They also plan to assess any long-term changes in crustal deformation in the regions over the course of the coming decades.

What other applications are there for the technology?
The team also applied this measurement technique to the study of the ocean. Physical oceanographers study ocean currents and flows of water using observations and computer models. Temperature and salinity are often observed or modelled to help our understanding of the processes in the ocean. Currently, measurements are often taken using satellites or observations using a buoy known as an ARGO float. Dr Yokota and his team used their measurement techniques to calculate a sound speed profile roughly from the sea surface to the bottom in order to study the characteristics of the ocean water. The speed of sound in water increases with increasing water temperature, increasing salinity and increasing pressure (depth). Therefore, the speed of sound at each depth can be used to help create a profile of the sea water’s characteristics for research purposes. Dr Yokota and his team created such a profile and compared the results of existing measurement techniques, showing that GNSS-A can be used to measure current flow paths. It reveals the underwater structure of the currents, unlike satellite observations, which only show surface conditions. The group’s plans for a continuous monitoring system will mean that ocean currents can be observed, contributing to the field of oceanography as well as earthquake sciences and predictions.

Personal Response
Do you think the prediction of large earthquakes and tsunamis in the region is going to be easier as a result of this new data?
In the near future, changes in SDR over time and detection of SSE will be reported. This is thanks to constant and great technological progress. If time changes can be detected, the detailed state before the earthquake can be known, and this will lead to great progress. But it will still not be enough. This observation is not real-time or continuous. Further technology development is required to enable more detailed interpretation of phenomena and the interplate boundary condition, emergency observations, and observations immediately before and after an earthquake for disaster prevention.