When less is more: Downscaling climate data for improved modelling
Accurate climate modelling requires long-term, high-resolution, and high-quality time series data. However, such datasets are often not available, especially in the Global South. Dr Andrew Fullhart (US Department of Agriculture) is utilising global climate datasets and machine learning to improve global coverage of gridded data. The results provide accurate monthly and daily time series for precipitation across Africa and South America, and offer a critical resource in areas where ground-based observational records are insufficient or non-existent.
The health and wellbeing of all living things, including human beings, are intricately linked to the soil and water cycles, which provide the basis for primary production. Moreover, among the many and varied impacts of climate change, soil health and the hydrological cycle are important components. Accurately modelling these variables requires long-term, high-resolution, high-quality time series data for a number of variables, not least precipitation. However, datasets that meet these requirements are often not available, especially in the Global South (eg, large swathes of Africa and South America). Ground stations providing long-term climate observations are largely concentrated in Europe, Australia, and North America, and this hampers our ability to model current and future evolution of critical climate parameters across large areas of land.
CLIGEN
Solutions to this issue include the use of popular global gridded datasets; from these, by using spatial averaging, models can estimate an average variable value at a given single (point-scale) location. However, this process of statistical data downscaling can result in significant modelling uncertainty, as averaged and interpolated values cannot reflect complex spatial and temporal variations in climate variables, even at very small scales. The stochastic weather generator CLImate GENerator (CLIGEN) may be used for statistical downscaling of global gridded data in areas where primary data sources are scarce (or non-existent), and has been used to provide point-scale data for various model applications, including those related to soil erosion and hydrology (note: the term stochastic relates to a process involving a random variable).

At the US Department of Agriculture (USDA)-ARS Southwest Watershed Research Center (Tucson, Arizona, USA), Dr Andrew Fullhart (also of the Long-term Agroecosystem Research [LTAR] network) is tackling this issue by using global climate datasets to improve the global coverage of gridded data. Most recently, Fullhart and his colleagues have developed a CLIGEN gridded dataset, yielding 20-year average
point-scale data with a resolution of 0.25 arc degrees (~25–28 km resolution in the tropics, depending on latitude) across Africa and South America. Biases in the input data are addressed using powerful machine learning-techniques.
Data sources
The grid created by Fullhart includes 40,936 points in Africa and 24,588 points in South America based on data from the past two decades. Among the data sources were satellite-based remote sensing datasets and climate model reanalyses, including: precipitation and temperature from ERA5-Daily (20-years of daily data from the European Centre for Medium Range Weather Forecasts); monthly water balance (including precipitation) from TerraClimate; GPM-IMERG (a high spatial resolution global precipitation measurement product with 30-minute temporal resolution, from which the monthly maximum 30-minute intensity was calculated); and solar radiation from GLDAS (Global Land Data Assimilation System data with 3-hour temporal resolution).
Ground stations providing long-term climate observations are largely concentrated in Europe, Australia, and North America.In addition, directly observed precipitation data from two global ground-based networks were collected, with a total of 11,065 stations. The first were long-term, gap-free data from the Global Historical Climate Daily Network (GHCN-D). Most of the GHCN-D data streams offered a 30-year record; however, given the lack of such long-term data from stations in Africa and South America, some shorter term datasets (eg, 20-years) were also included. Finally, a high temporal resolution dataset (data with 1-minute intervals) covering the United States was included. This observed precipitation data informed the statistical downscaling approach with the degree of bias related to spatial and temporal scaling that is present in the grid-scale data.

Machine learning
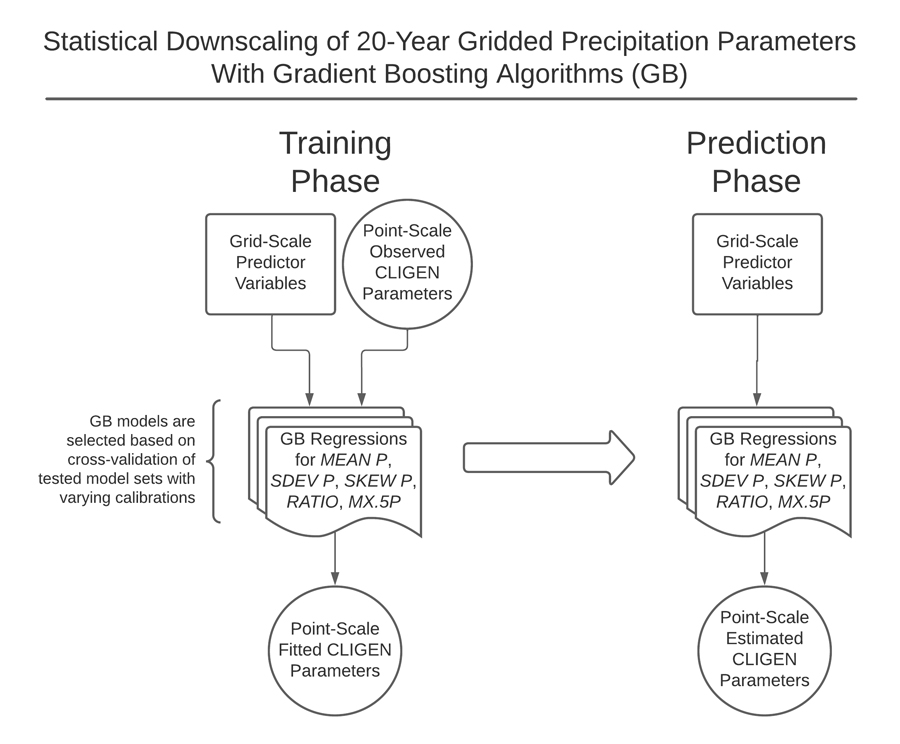
To downsize the gridded datasets to point-scale data, a gradient boosting machine learning-technique was used. In total, 21 variables were considered, including mean precipitation, annual rainfall, surface air pressure, latitude, and elevation, along with a variety of statistical measures. Gradient boosting uses a series of decision trees to create subsets of data. The first step in machine learning is model training; in this step, a regression was performed for each variable and optimal models were selected by cross-validation. The gradient boosting modelled data were then compared with known point-scale values measured at ground stations. The accuracy of the model could then be determined. Based on the results of the training phase, the final model is constructed, from which users can determine point-scale data from the gridded datasets.
Fullhart and colleagues found that their gridded dataset provides accurate monthly and daily point-scale values for different variables (eg, mean precipitation, predicted days of precipitation within a year). Using the point-scale data downscaled by CLIGEN, climate models were able to accurately recreate the highly heterogenous spatial distribution of rainfall across Africa, from the very low precipitation of the Sahara, Sahel, and Kalahari regions, to the very high precipitation of the Congo Basin. Spatial variation on smaller scales was also reliably recreated; for example, precipitation across Ethiopia, which is in part controlled by the rugged terrain and heterogenous topography. CLIGEN gridded datasets can facilitate accurate models of temporal variation over annual timescales, eg, high rainfall in high-elevation areas between July and August. In addition, in cases where only short ground records are available, the outputs may actually be more reliable than those from ground observation stations, which often struggle to effectively measure high rainfall variability. Similarly promising results were found in Brazil, which includes six biomes that exhibit highly variable precipitation (from less than 800 mm a year in the semi-arid Caatinga bioma in the northeast, to more than 3,000 mm a year in the northern Amazon biome).
Statistical data downscaling can result in significant modelling uncertainty, as averaged and interpolated values cannot reflect complex spatial and temporal variations in climate variables.Modelling the dynamics of rare extreme storms with high-intensity precipitation remains a challenge. In particular, when using CLIGEN grids to model extreme precipitation for sub-daily time frames, bias corrections need to be carefully considered. For example, systematic overestimation bias by a factor of 1.2–1.4 was identified for larger areas over 10- to 60-minute time frames. In contrast, systematic underestimation of sub-hourly precipitation intensities along the equator were noted.
Interestingly, the spatial distribution of the ground observations used to verify and train the model could not explain all areas of model bias. For example, even across the continental USA, where ground stations are abundant, some model outputs failed accuracy tests. Fullhart suggests that other factors, including the distribution of climate zones, play an important part, and that climate zone-based spatial weighting using statistical methods could improve model outcomes. Ultimately, these issues with sub-daily and sub-hourly precipitation point-scale data generation will impact on subsequent modelling of soil erosion and hydrological factors. In cases where overestimation bias was identified for extreme events, overestimations of runoff and sediment yields (ie, overestimation of erosion) may subsequently occur. On this basis, Fullhart suggests that large erosion events associated with extreme precipitation should be treated with caution when using data down scaled from CLIGEN grids.
Hydrological and erosional modelling applications
The production of climate time series for modelling can be a time-consuming and elaborate process. In worst-case scenarios, the lack of climate data can effectively prohibit modelling from being performed at all. Therefore, the availability of reliable global CLIGEN datasets can facilitate important research applications by providing model inputs for places where they may not have been previously available.
The time series generated by Fullhart’s approach are reflective of key statistical characteristics that would be expected from long-term ground observations. When considered together with all known CLIGEN grids, coverage is now available for the majority of ice-free global land masses, with near total coverage of areas south of 40°N. These stochastic CLIGEN time series offer a critical resource in areas where ground-based observational records are insufficient and in ungauged study areas. For the purposes of risk-assessment, CLIGEN can be used to produce arbitrarily long records, which is beneficial for understanding long-term averages and infrequent extreme events. CLIGEN time series can also be used to test novel hydrological hypotheses, particularly with regards to interannual variability. Such improvements to our climate modelling capabilities are a key component in the effective management and mitigation of global climate change and its consequences.
Personal Response
To date, is CLIGEN a purely academic tool? Or, has it been adopted for operational reasons, for example, by meteorological services for short- and long-term weather prediction?CLIGEN has primarily been used in the context of soil erosion modelling because of its ability to generate long-term precipitation time series with accurate representation of precipitation intensity. Operational workflows exist for land managers to perform risk-assessments driven by CLIGEN. One such application is the rangeland hydrology and erosion model (RHEM), and some of the mentioned CLIGEN datasets have been integrated into the RHEM web tool. Use of CLIGEN in a meteorological context has been largely academic, but the potential exists for applying CLIGEN to disaggregate long-term forecasts, such as for agricultural crop modelling, or for disaggregating climate change projections.