ILLMO: A new platform for interactive statistics
Scientists and researchers who are not specialists in statistics nevertheless rely on statistical analysis to draw conclusions from the data they collect in order to validate their research outputs. Often, they employ existing statistical programs, such as SPSS and R, which offer a wide range of data analytics techniques and processes. These programs, however, depend on the user’s familiarity with statistical methods and terminology and provide little insight into how the statistical models and techniques actually work and into the assumptions underpinning their results.
Dr Jean-Bernard Martens, a Full Professor on Visual Interaction with the Department of Industrial Design of the Eindhoven University of Technology, Netherlands, has developed ILLMO (Interactive Log Likelihood MOdeling), a statistical modelling tool that provides an interactive environment offering an intuitive and interactive approach to statistics.

What statistics does versus how statistics works
Prof Martens draws on his experience working amongst the applied psychology community in his own field of research in human-computer interaction (HCI). He explains how the scientific community understands the relevance of statistics in their research, albeit that the motivation can be extrinsic, in that it is required to model quantitative data, and to get it published. He has also observed that there seems to be confusion among these researchers “about what statistics actually does (or doesn’t do), as there is virtually no understanding of how statistics works”. This can lead to perplexity and uncertainty when it comes to interpreting statistical results, or in more severe cases to statistics anxiety – the feeling of apprehension some individuals experience when they are exposed to statistical content or problems, or when gathering, processing, and interpreting data.
Common problems
Many researchers would not describe themselves as expert statisticians and lack confidence in both statistical outcomes and their interpretation. Prof Martens reflects on how a lack of understanding can also result in the erroneous use of statistical methods. While most researchers understand what rejecting the null hypothesis means, many struggle with the concept of the alternative hypothesis and what they should do once they have rejected the null hypothesis. Furthermore, there is confusion around the concepts of effect size (a quantitative measure of the strength of the relationship between two variables) and statistical power (the probability that a statistical test will detect differences that actually exist), yet the American Psychological Association style guidelines requires its authors to publish effect sizes alongside significance levels.
Many statistical techniques, although they appear to be different, can actually be derived from a few basic principles.
Researchers often resort to using standard parametric tests, including the Students t-test and Analysis Of Variance (ANOVA), in cases where they are not necessarily appropriate, such as when analysing ordinal Likert-scale data. Moreover, many empirical researchers appear to be unaware that these methods assume that data distributions are continuous and Gaussian, i.e. normally distributed. Furthermore, the verification of assumptions to ensure that the chosen method is suited to the collected data is often disregarded.
The user experience perspective
This current situation with statistical practice is a stark contrast to the user experience perspective on technology that drives the CHI community where “technology should support people in enjoying their activities and help them to be confident about the work that they produce”. In addition to the ILLMO program, Prof Martens has developed the CHI course “Insights into Experimental Data through Interactive and Intuitive Statistics” to help eliminate some of the myths surrounding statistics. He demonstrates how many statistical techniques, although they appear to be different, can be derived from a few basic principles.
Participants in this course also have the opportunity to practice this new approach in the interactive statistics environment offered by the ILLMO program, where they discover how to perform frequently used statistical tasks, including hypothesis testing, linear regression and clustering, in a more intuitive and interactive way. The wide range of visualisations offered by ILLMO are of particular assistance to novice users, helping them to grasp the various statistical concepts.

A single approach for a wide range of statistical problems
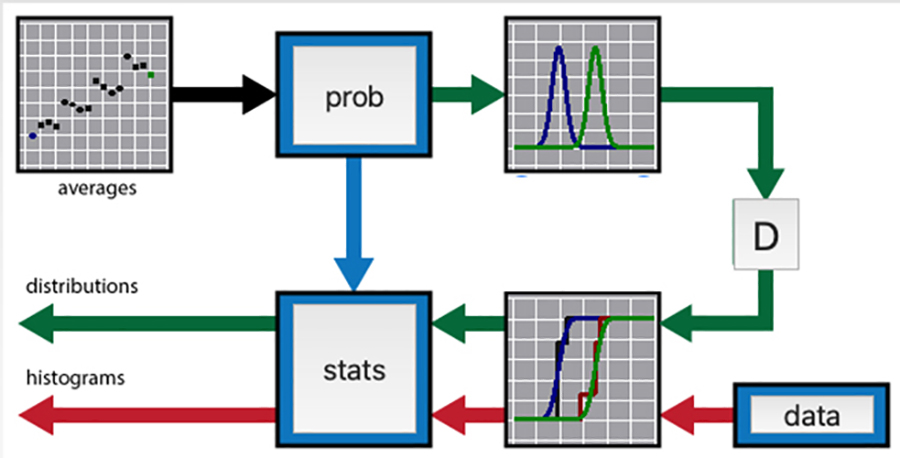
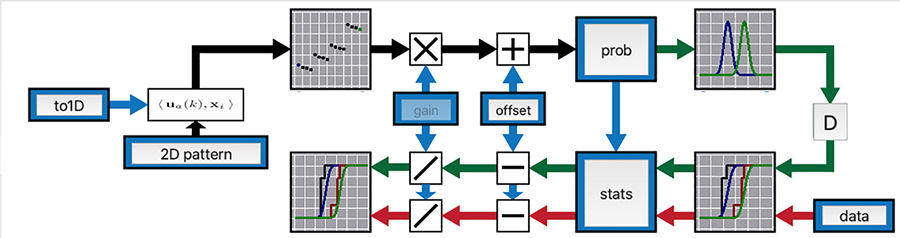
Many non-statisticians interested in empirical research and data science find statistical terms such as significance and statistical power confusing. In light of this, Prof Martens uses the recent theory of multi-model comparisons, which explains how to balance goodness-of-fit and number of degrees-of-freedom in a statistical model, to offer an alternative interpretation. He describes how ILLMO uses a single approach for a wide range of statistical problems. ILLMO employs the log-likelihood criterion for continuous data and the Cressie-Read convergence criterion for discrete data to measure the goodness-of-fit between the original data and the modelled distributions. ILLMO minimises this criterion when estimating model parameters such as averages and standard deviations. Amongst others, this implies that ILLMO uses a uniform approach for analysing continuous and discrete data.
Hypothesis testing
Prof Martens demonstrates how ILLMO uses multi-model comparison to carry out hypothesis testing. Here, the output is the likelihoods of two models. One has the same average for both conditions being tested, similar to the null hypothesis. The other has averages that differ between conditions, similar to the alternative hypothesis. The user can only conclude that one model is clearly preferred over the other when the ratio between the likelihoods is high, i.e. greater than 20.
The log-likelihood profile is a graph showing a variation in the log-likelihood criterion or the Cressie-Read convergence criterion. It is used by ILLMO to ascertain the accuracy of a parameter that has been determined by the data. The confidence interval for this parameter can be found at the intersection of the log-likelihood profile and a predefined value. This can be used to make statistical inferences as to whether this parameter differs from a hypothesised value.
Regression
ILLMO can also use multi-model comparison to perform both linear and multiple regression. The multi-model comparison output is the likelihoods of regression models with different independent variables in the case of linear regression, or various numbers of independent variables when dealing with multiple regression.
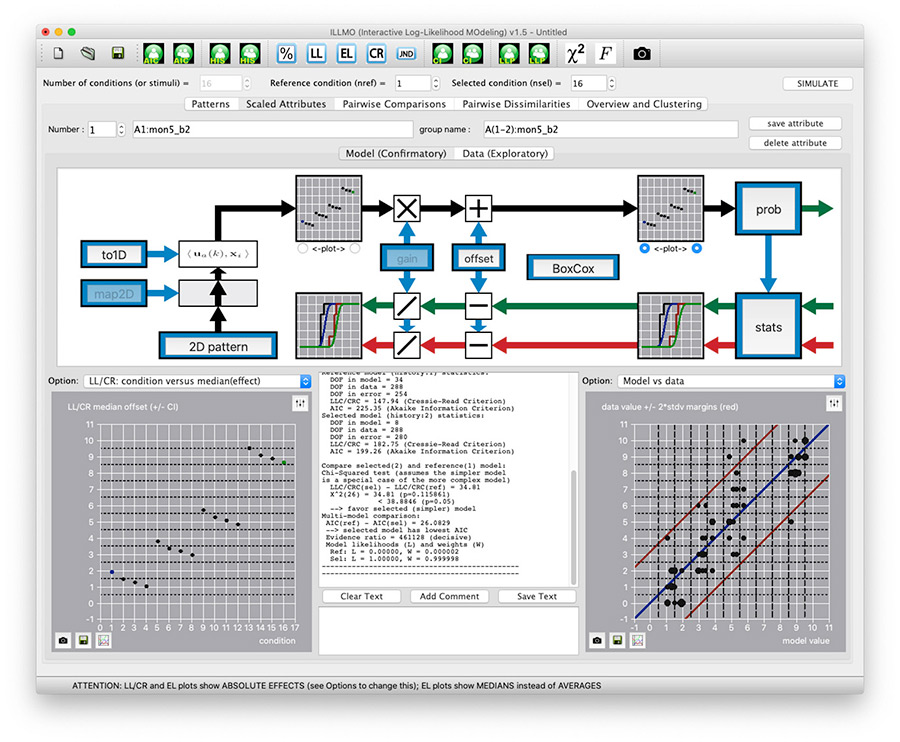
Graphical interface
ILLMO’s graphical interface allows the user to easily modify a statistical model in order to describe and analyse their dataset. The interface is designed to encourage users to experiment with alternative models and compare them visually with the default model. The default model uses Gaussian distributions in line with traditional statistics. ILLMO can carry out multi-model comparisons and assign likelihoods to each of the alternative models under consideration.
The wide range of visualisations of the ILLMO program are of particular assistance to novice users, helping them to grasp the various statistical concepts.
Range of visualisations
ILLMO integrates all aspects of its statistical analysis in a single interface. It displays the model specification together with the data analysis results in both textual and graphical form. Moreover, ILLMO offers approximately 60 options for plots in order to illustrate the information generated by the statistical modelling. These can depict relationships between the observed histograms and the modelled distributions, as well as information such as confidence intervals that is required for statistical inferences.
Comparing results
ILLMO facilitates the comparison of results obtained from its log-likelihood modelling with those produced by the default model, such as ANOVA, regression analysis and t-tests, that rely on the specific assumption of Gaussian distributions.
Empirical likelihood
ILLMO includes empirical likelihood, a relatively new method for performing non-parametric statistics. Empirical likelihood is an estimation method that requires fewer assumptions regarding the error distribution. It provides an elegant solution when data cannot easily be approximated by a known parametric distribution.
Software availability and supporting material
Prof Martens has created ILLMO to offer user-friendly, interactive statistics for a wide range of users. He has provided both Mac OS and Microsoft Windows versions of the ILLMO program that can be downloaded from the project website (http://illmoproject.wordpress.com), together with supporting material. This includes detailed descriptions and instruction videos on the wide range of statistical analyses that can be accomplished with ILLMO. Prof Martens is currently developing an extended version of the ILLMO platform that will include machine learning. In this way, confirmatory data analyses that go well beyond (linear) regression models will become feasible.

Personal Response
What inspired you to develop the ILLMO platform?
<> When writing the book ‘Image Technology Design: A Perceptual Approach’ I had to perform statistical analyses (more specifically, the joint analysis of attribute, comparison and dissimilarity data) that were not possible with existing software, which led me to develop a program called XGms for this purpose. I quickly noticed that students who were attempting similar analyses with this program experienced significant problems. Overcoming such problems required a much more flexible program architecture and interface, which ultimately led to the ILLMO program in its current form. Today, there is an increasing demand for literacy in Machine Learning (ML), a subfield of Artificial Intelligence (AI), which is why I’m currently developing ILLMO 2.0 which will integrate the statistical strengths of ILLMO 1.0 with many existing (as well as some new) ML methods.