Nonoverlap proportion and the point-biserial association problem
Cloud computing technology with its on-demand resources has become an essential part of daily life. Search engines serve as all-encompassing sources of information, providing details such as our favourite restaurants, health, genetics, and investments. This information comes from data stored in large server farms. These data repositories can be envisaged as giant spreadsheets made up of columns containing numbers or labels. Algorithms, such as the classification and regression tree (CART) algorithm, are required to perform high-dimensional searches of the data to discover patterns and generate useful information for making decisions.
While comparing results from CART analyses with those from genome-wide association studies (GWAS), Dr Stanley Luck, statistics consultant and founding member of Vector Analytics LLC, Delaware, noticed that the results from the CART analyses did not correspond well with the statistical associations of the GWAS. This led him to uncover the extensive research literature that discusses the confounding properties of effect size measures used in his analyses.
Unresolved controversies
Dr Luck demonstrates how ‘statistics practice is subject to fundamental unresolved controversies and contradictions’. This is not a new notion, as many researchers have commented on the use and misuse of p-values and statistical significance, criticising the ‘p-value paradigm’. The current reproducibility crisis, where it has been uncovered that many scientific studies are difficult or even impossible to replicate, serves as further evidence of problems in statistics practice.
There is still a lack of consensus on the merits of the
statistical methods that are widely used for the
point-biserial problem
Dichotomous data and the point-biserial problem
Dr Luck is particularly interested in an elementary form of dichotomous data often obtained in case-control studies. Suppose, for example, that a group of researchers are conducting an experiment to test the effectiveness of a new vaccine. They would administer either the new vaccine or a control to a group of patients and then collect immune response data for the patients. Immune responses would be recorded as a numerical measure of the quantity of T-lymphocytes – white blood cells that form part of the immune system – and antibodies. The data would then be stored in a spreadsheet as a mixed data-type set, as a column of numbers and a corresponding column of labels for vaccine and control.
In applied statistics, the analysis of such dichotomous data is referred to as a ‘two-sample’ or ‘point-biserial’ association problem. It has applications in many research fields. Dr Luck discusses how, despite extensive research, there is still a lack of consensus on the merits of the statistical methods that are widely used for the point-biserial problem. For instance, the two-sample t-test is archetypal for p-value methodology. The American Statistical Association, however, has recently issued a warning about the misleading properties of p-value for statistical significance. Moreover, concerns about the lack of rigor in research led the National Academy of Science to conduct a study of reproducibility and replicability.
Nonoverlap data
This applied algebraic study of the point-biserial problem was prompted by research on genomic variation in maize at US company DuPont. The data are represented as points in a finite-dimensional vector space, and information is algebraic. Dr Luck explains that point-biserial data can either be sorted categorically or numerically and reveals how the numerical sorting is associated with a novel nonoverlap proportion measure (ρ) for the categorical data.
Overlap data can be visualised as the data points that overlap from one phase (baseline) to another phase (treatment). The proportion of nonoverlap data is traditionally measured as a percentage. The percentage of nonoverlap data is a widely used non-regression effect size descriptor that provides a measure of treatment effectiveness. The higher the percentage of nonoverlap data, the stronger the support for a treatment’s effect. Effect size indicates how meaningful the relationship between variables or the difference between groups is. It signifies the substantive significance, or practical significance, of a research outcome.
Three forms of correlation
Dr Luck highlights the need to distinguish between the three algebraic forms of correlation. Pearson correlation refers only to the linear relation between numeric data. Point-biserial correlation refers to the nonoverlap of dichotomous data. The third form of correlation is associated with proportional variation for a 2 x 2 contingency table. The common practice of conflating these into a single overarching ‘Pearson correlation’ is misleading and his work shows that point-biserial correlation and the phi coefficient, which measures the association of two binary variables, are both subject to confounding effects.
Nonoverlap proportion
Dr Luck developed the nonoverlap proportion when he was faced with the problem of how to formulate an algebra for mixed-data types. The nonoverlap proportion measures the degree of nonoverlap between two sets of numerical data. It is the difference in sample size proportions for the degree of separation of the labels obtained by sorting the numeric data. Since it is calculated directly from the data, it is nonparametric as the underlying densities are unspecified. Nonparametric tests do not rely on any probability distribution and can therefore be applied even if the parametric conditions of validity are not met.
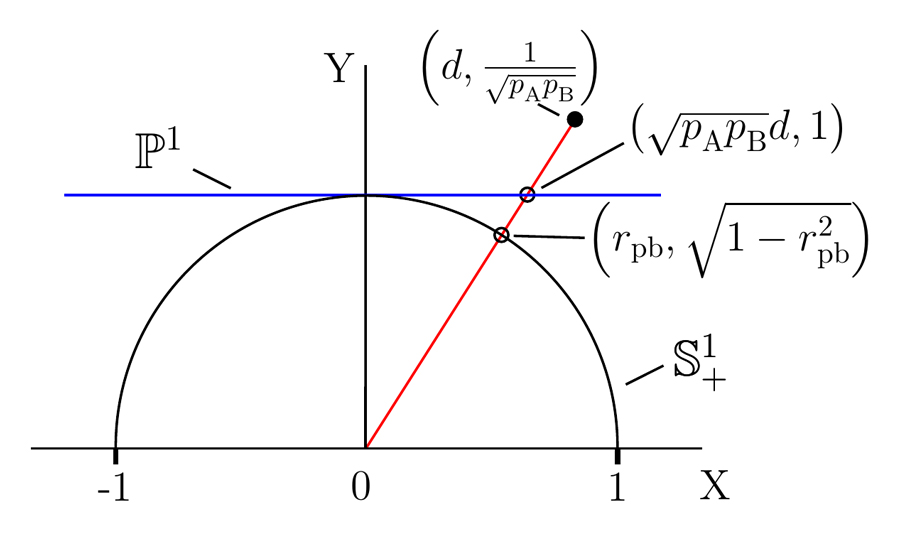
Dr Luck proposes that the statistical parameters for both the categorically sorted and the numerically sorted data form a complete set for representing the variation of point-biserial data. The various effect size measures therefore correspond to different perspective functions of the point-biserial variation parameters, i.e., different coordinate systems that can represent the point-biserial variation.
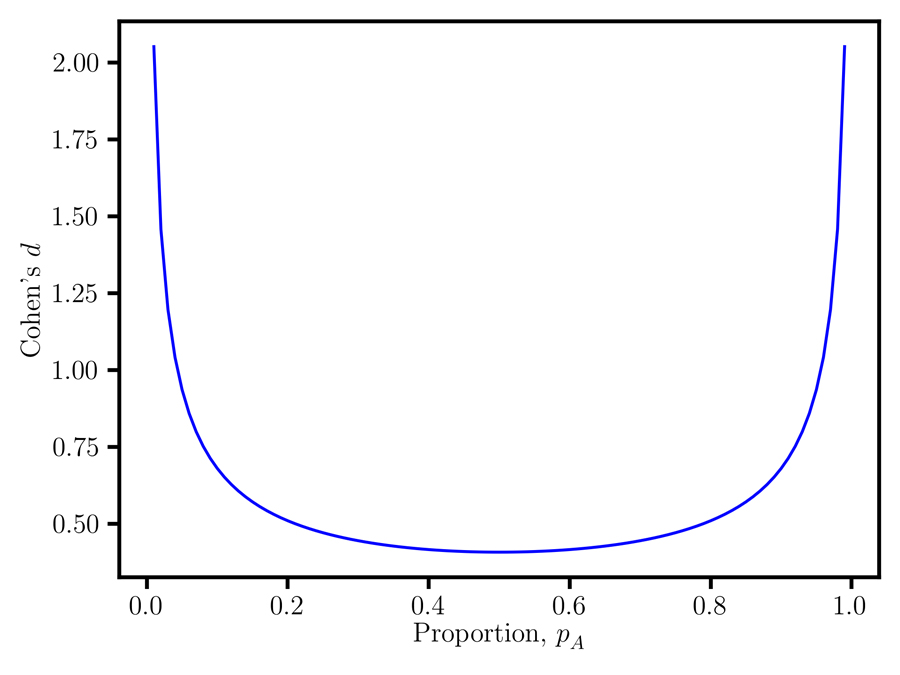
Cohen’s d
Cohen’s d, for example, an effect size measure for comparing two groups, is calculated as the difference between two sample means divided by the pooled variance. It gives the difference between the means in terms of standard deviations. The mean values are associated with two degrees of freedom (the number of values which are free to vary) and the difference corresponds to their transformation to centre of mass coordinates. Cohen’s d is therefore a perspective function of centre of mass coordinates, where the centre of mass is the unique point at the centre of a distribution.
Dr Luck discusses the homogeneous coordinates equivalence between Cohen’s d and the point-biserial correlation coefficient rpb. Then, Cohen’s d, rpb and the nonoverlap proportion can all serve as measures of nonoverlap. He discovers that point-biserial data are associated with at least three statistical parameters, namely Cohen’s d, the mean, and the nonoverlap proportion, and warns that data analysis protocols that do not account for all of these parameters can give misleading, irreproducible results. He also shows that assessing the substantive significance requires the specification of cost-benefit trade-offs between these three parameters, as it is difficult to reach a consensus on the merits of an effect size without this information. This is why mathematical considerations alone are not sufficient for identifying a unique coordinate system and an effect size for a dataset. The specification of functional or engineering requirements is also needed.
CART algorithms
Classification and regression tree (CART) algorithms can be used to search for patterns and relationships in highly complex data. CART, a predictive algorithm, is a methodology for exploring possible solutions for a complex decision-making problem. It explains how a target variable’s values can be predicted using other values with a decision tree. Each branch is split according to a predictor, or independent variable. Each node at the end of the branches has a prediction for the target variable being modelled.
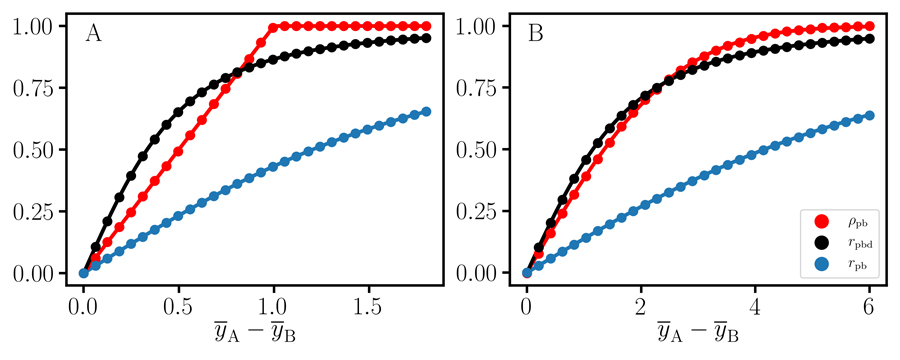
Samples of unequal size
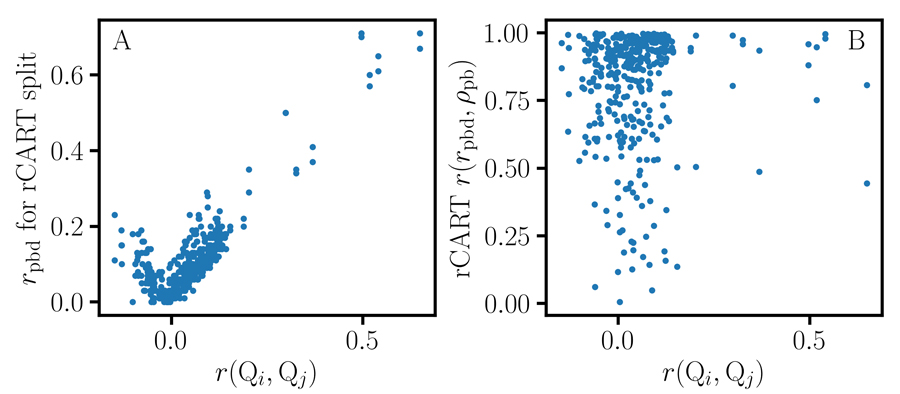
The point-biserial correlation coefficient can fluctuate when comparing two samples of unequal size. This can result in misleading results in CART regression tree analysis. Dr Luck developed the CART association graph, a new method for analysing statistical association in point-biserial data that compares the performance of various effect size measures. Using the CART association graph, he compares the performance of the point-biserial correlation coefficient, nonoverlap proportion, and another measure of correlation, the sample size proportion corrected correlation. He shows that nonoverlap proportion and the sample size proportion corrected correlation produce more intuitive results and serve as effect size measures for CART. Using these measures also avoids the complications associated with point-biserial correlation, particularly considering the concerns about reproducibility.
Data analysis protocols that do not account for all of these parameters can give misleading, irreproducible results.
An improved CART association algorithm
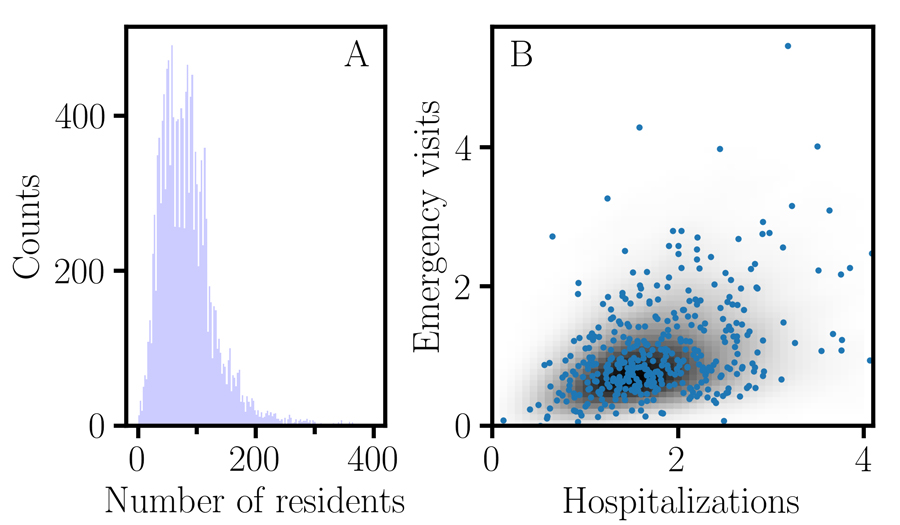
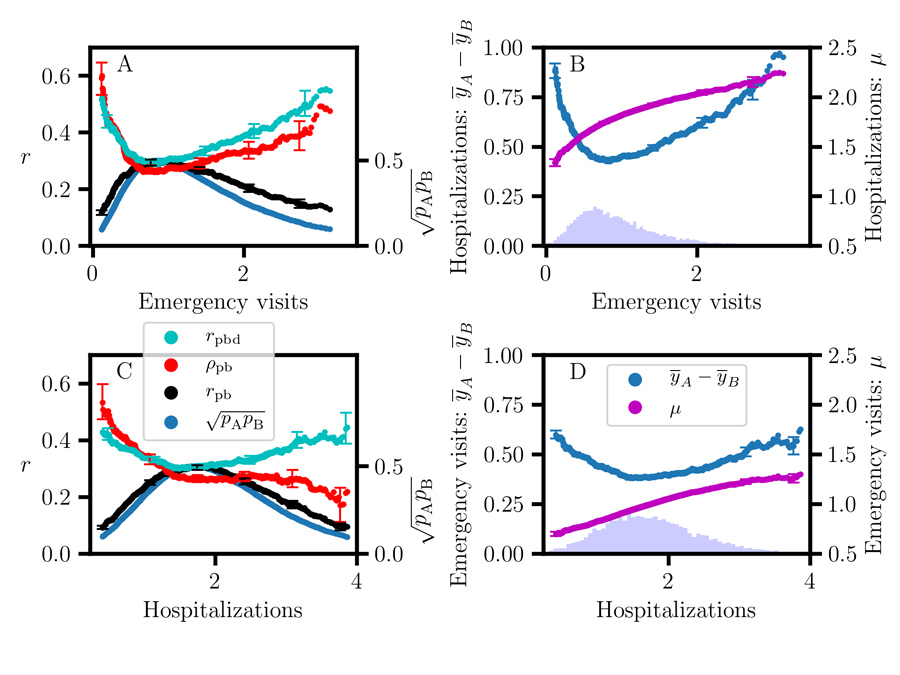
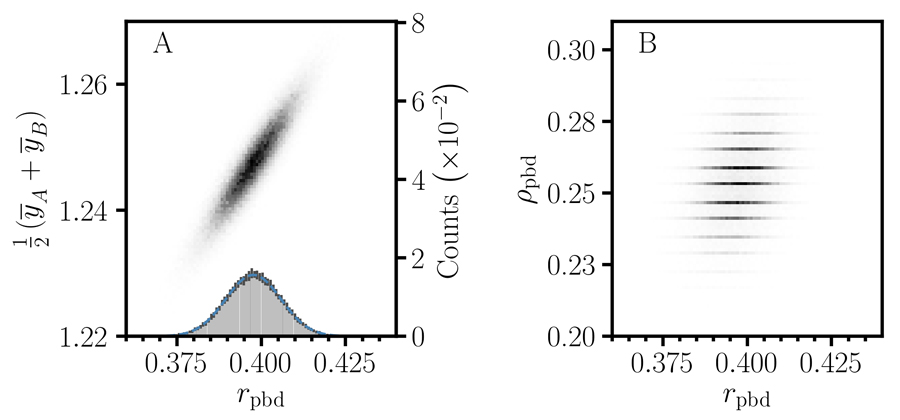
Dr Luck has incorporated these effect size measures in the development of an improved CART association algorithm, using a proportional displacement measure with correction for unbalanced sample size for the response. He demonstrates its use in a high-dimensional search problem of nursing home performance by applying it to the publicly accessible Nursing Home Compare (NHC) database. The algorithm generates distributions for the number of emergency hospital visits and the number of hospitalisations per 1000 long-stay residents. Monte Carlo methods, computational algorithms using repeated random sampling, are employed to estimate the joint distribution of statistical parameters.
The results demonstrate the limitations of point-biserial correlation in CART as well as offering insight into the behaviour of nonoverlap proportion and the sample size proportion corrected correlation. They also highlight the importance of accounting for all three degrees of freedom: the sample size proportion corrected correlation, the mean, and the nonoverlap proportion, to obtain reproducible results.
Broader implications
In developing this novel algorithm for cloud computing technology, Dr Luck has observed that a better understanding of the applied algebraic foundations together with improved methodology are important for the application of effect size in data analytics. He concludes that ‘there must be consensus across disciplines. At a fundamental level, data analysis algorithms must apply generally. It makes no sense to have different sets of algorithms for physics versus biology.’

Personal Response
What initially sparked your interest in statistics? <>
My interest in statistics developed naturally as a necessary part of my physicochemical research. In studying a quantitative phenomenon, it is important to have a rigorous intuitive connection between experiment and theory. Then, robust statistical methods are essential for distinguishing between signals and noise, the discovery of novel phenomena, and the development of new technologies.