Using low-cost sensors and citizen science to examine air quality
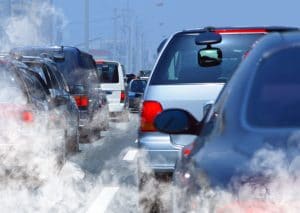
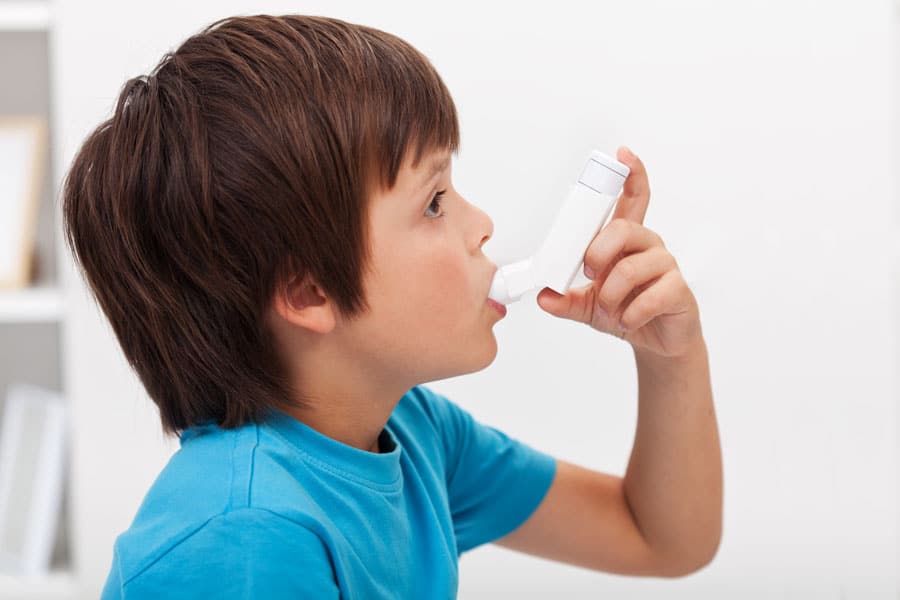
Despite many initiatives and efforts to reduce tailpipe emissions from motor vehicles, traffic-related air pollution (TRAP) remains a problem. TRAP is full of toxic substances such as carbon monoxide (CO), nitrogen dioxide (NO2), particulate matter (PM), benzene, 1,3-butadiene, formaldehyde, acrolein, and acetaldehyde in addition to precursors for ozone (O3) production. The long-term detriment of exposure to these pollutants on human health is well known, increasing risk of respiratory and cardiovascular disease, especially among children, elderly, and pregnant women.

In addition, areas of poor air quality are generally also regions of a lower socio-economic status. Low-income housing has historically been built close to areas of pollution such as industrial point sources or high-traffic roadways. To make matters worse, the inhabitants of these areas are often less well equipped to deal with the consequences of this pollution, be it due to lack of facilities, healthcare, or income. Thus, it is important when examining air quality, to ensure data is collected over a gradient of wealth, land-use, and demographics. Dr Andrew May and colleagues from The Ohio State University are teaming up with teachers and students across the Hilliard City School District (HCSD; Hilliard, Ohio, USA), Dublin City Schools (Dublin, Ohio, USA), and Worthington City Schools (Worthington, Ohio, USA) to address this very issue in order to provide a reliable map of local air quality. Potential uses of these maps include alerting policy makers to enforce changes to traffic flow, identifying areas for greater scrutiny for air quality regulation, and informing susceptible populations about areas to avoid on poor air quality days.

LOW-COST REMOTE SENSORS
One of the issues surrounding the measurement of air quality in urbanised areas is the large variability in environments, and the low spatial resolution at which this occurs. For example, there could be a multi-lane highway adjacent to a large green space. One sensor across this area will only capture an average which would not be valid for either land-use type. This is predominantly the current issue in Franklin County Ohio, where US Environmental Protection Agency (EPA) monitors are located to the northern and eastern portions of the county, thus missing a substantial portion of the county entirely (including the ‘downtown’ urban core) as well as any changes in air quality within ‘micro-environments’ between the monitoring sites. This is particularly a problem since data from the Center for Disease Control’s Behavioral Risk Factor Surveillance System Survey (BRFSS for short) has shown that asthma incidence rates are heterogeneously distributed and the highest prevalence tends to be in the central and southern portions of the county. Therefore, the data that the existing monitors provide may not be representative of actual air quality within those micro-environments.
…harnessing the power of citizen science, combined with the ever-advancing world of remote technology.
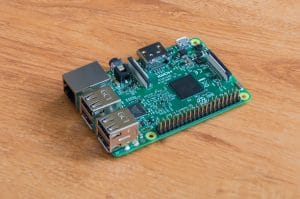
The initiative outlined by project investigators (PIs) Dr Andy May and Dr Ayaz Hyder aims to solve this problem through harnessing the power of citizen science, combined with the ever-advancing world of low-costs sensors and cloud-based technologies. US EPA monitoring equipment costs hundreds of thousands of US dollars, and will be extremely accurate, but lack the power of a cost-effective ‘sensing network’ that can be widely-distributed. By combining various aspects of ‘off the shelf’ sensor components, three cohorts of Grade 12 students have worked with the PIs to construct a small, low-cost, low-maintenance remote sensor packages which operate semi-autonomously with connectivity through a Wi-Fi network. These ‘TRAP monitors’ contain sensors that measure CO, NO2, O3+NO2, PM, and relative humidity/temperature and are attached to a Raspberry Pi 3 single-board computer for data acquisition and transmission to the cloud. These devices require some background knowledge in digital electronics and computer programming (e.g., Python) to fabricate the devices and transmit data. This information is being taught to the HCSD high school students directly involved in the project through an engineering curriculum at their school.

Wireless sensors of this nature do not come without their own problems. Weatherproofing and battery life are practical challenges which the students (under the guidance of the PIs) are actively working to resolve via a solar panel unit and full weatherproof housing for each device. Low-cost sensors may also be subject to bias and ‘baseline signal drift’ when compared with US EPA monitoring technologies; there are ways to account for these issues including recalibration of the sensors or the implementation of data analytics tools.
MEASUREMENTS AND DATA
Initially, the devices undergo a calibration procedure at The Ohio State University using reference instrumentation that is similar to those deployed by the US EPA. This enables the translation of the sensors’ raw output signal to a pollutant concentration. Once returned to the schools, students are trained on the basic Python code, and work together to deploy the sensors in an area with suitable Wi-Fi connectivity. Around ten sensors will be deployed at various schools across the HCSD, covering a gradient of traffic flow and socioeconomic status.
The primary goal is to determine the quality of recordings across time. All the data will automatically upload into the ‘cloud,’ specifically Google’s FireBase, where it can be centrally accessed for analysis. The data is then drawn from the cloud into a script written in the R programming language that enables data visualisation via a website using Shiny R (currently in beta development). This is of course after any necessary calibration and statistical adjustment for biases such as baseline drift. One of the many benefits to the cloud-based approach will be the ease at which the PIs can link US EPA data allowing for a direct comparison assessment.
Its low-cost, citizen science blueprint spreads the workload across institutions whilst integrating education and STEM themes.
The amount of data received has a huge potential for analysis and also covers a wide breadth of scientific disciplines which can be integrated into HCSD school curricula. Primary visualisations will be maps of air quality across the HCSD for each pollutant, and the levels of each pollutant at various chool sites. These data can be readily compared to data regarding traffic flow, population, socioeconomic status, land-use, temporal patterns, and also comparison against the US EPA’s data.
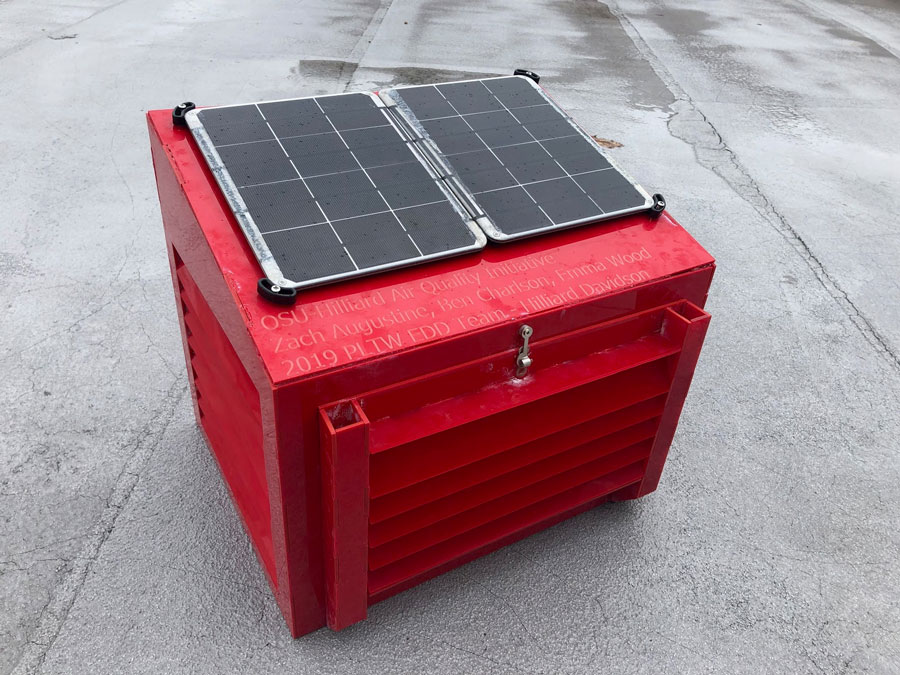
(Photo credit: Zachary Augustine).
CITIZEN SCIENCE AND EDUCATION
This project really kills two birds with one stone. Not only will the new sensors provide important long-term temporal and spatial data, but the PIs are also working alongside schools in the HCSD to integrate science into the curricula. The students collaborating on the HCSD initiative use this as their project in an Engineering Design and Development course, and learn about engineering, public health, environmental science, and statistics. They have gained first-hand experience on the iterative nature of this process, since the second year had the previous year’s work and made improvements, and the third year has improved on the first two years. The current team of students identified for the fourth year will continue to build on these efforts.
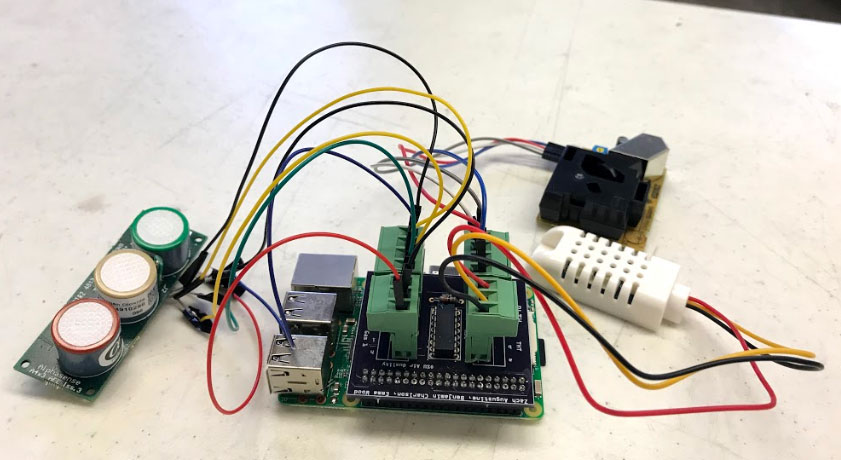
(Photo credit: Benjamin Charlson).
Furthermore, the initiative increases links between universities and schools, allowing students to contact and communicate with local experts, and take part in large scale scientific research otherwise unreachable until further education. Past students have indicated that participating in this project has given them a leg-up over many of their peers in introductory engineering courses at university.
In order to cover the HCSD (160 km2), there will be ten sensing stations deployed across school buildings in the HCSD area, and these will require upkeep. After students have completed the design, fabrication and deployment step, schools across Columbus OH (USA) will use the sensors as subjects for teaching data science and public health. In parallel with this teaching, they can easily check on the status of the sensors and report back data or damages (including localised warnings for asthmatics or other sensitive groups), truly embracing the power of citizen science.
A further benefit of integrating the HCSD community comes through the collaboration of committees inside education such as the HCSD School Board, and organisations outside of education, such as the City of Hilliard’s Environmental Sustainability Commission. Students have presented progress presentations to these groups, which can lead to tangible actions regarding traffic flow around schools, a drive towards public transportation, and further public awareness on the problems associated with air pollution.
This work has also led to other collaborations centered on education. Dr May and Dr Hyder have recently begun work with Dublin City Schools’ Emerald Campus’ Engineering Academy to integrate a similar project into their curriculum, and Dr May has been working with the Columbus Public Health Department and Worthington City Schools to install sensors that will provide localised data for students to explore in the classroom.

This project ticks two final important boxes. Firstly, the data will be of continuous importance to the long-term monitoring of air quality in Columbus OH. If real-world changes are made the sensors will be vital to understanding if these changes are successful. Secondly, this initiative has the potential to be expanded across cities across the US, and the project template could be used worldwide. Although other groups are deploying low-cost sensors in urban areas what sets this project apart is the strong collaboration with local high schools. This low-cost, citizen science blueprint spreads the workload across institutions whilst integrating education and STEM themes. Hopefully it won’t be long until we see the TRAP reeling in data across cities in Europe, Asia, and beyond.
Personal Response
What advice would you give to other researchers about to embark on a citizen science project?
<> 1. Start early! We were very lucky to find some teachers and school districts who were willing collaborators from the outset, but this may not always be the case.
2. Temper your expectations. At this point, we only have limited data collection with HCSD. This has been integrated into a course, so there are other educational objectives that the students must meet. It also took a while to fully get things up and running, and there has been some iteration on the previous efforts during each subsequent year. We could address this issue by explicitly providing the students with a model for how to do everything but allowing them to struggle through the problem-solving and engineering design on their own is arguably better from an educational perspective.